
Tariffs and Trade Policy: Understanding the Current Landscape
Global trade flows shifted significantly in 2025. What changed, why it matters, and what investors and businesses are watching now.
A Shift in Trade Policy
The United States entered 2025 with an average effective tariff rate of approximately 2.5 percent on imported goods. By mid-year, a series of executive actions had pushed the effective tariff rate to approximately 16.8 percent, levels not seen in roughly eight decades.1 The scale of the change was significant by historical standards: the last time the United States imposed tariffs of comparable breadth, the global trading system looked fundamentally different.
Tariffs are taxes collected at the border on imported goods, paid by the domestic importer and often passed along, in whole or in part, through the supply chain to businesses and consumers. They have long been used as tools of trade policy, but their prominence as an instrument of fiscal and economic strategy grew considerably in 2025. Understanding what these policies do, and what remains uncertain about their effects, is worth the attention of anyone with exposure to markets, businesses, or the broader economy.
The Revenue Math
The Congressional Budget Office’s February 2026 Budget and Economic Outlook estimated that higher tariffs implemented in 2025 would reduce federal deficits by approximately $3.0 trillion over the 2026 to 2036 period, accounting for both direct revenue and related changes in the economy.1 That figure reflected tariff revenues at the rates in effect at the time of the projection.
The revenue picture shifted materially in late February 2026, when the Supreme Court ruled that tariffs imposed under the International Emergency Economic Powers Act, which had accounted for roughly half of all customs duties collected since January 2025, could not be maintained under that authority. The CBO subsequently estimated that the termination of those tariffs increases projected deficits by approximately $2.0 trillion over the 2026 to 2036 period.2 Other tariffs implemented under separate statutory authority, including product-specific measures on steel, aluminum, and certain goods from China, remain in effect.
The episode illustrates a broader dynamic that runs through the current trade environment: the revenue math is sensitive to legal and political developments that are difficult to anticipate. For investors and businesses assessing long-term fiscal conditions, the distinction between what was projected, what has changed, and what remains in place is an important one.
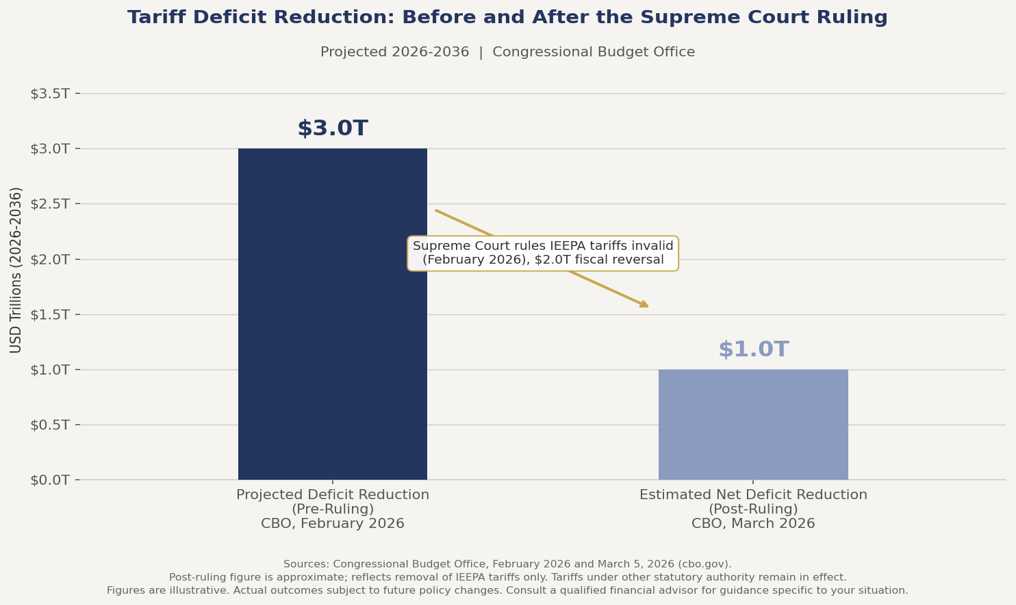
Figure 1: Tariff Revenue, Gross vs. Estimated Net Deficit Reduction. Source: CBO, February 2026. Figures are illustrative of CBO projections as of that date and reflect tariff policy prior to the February 2026 Supreme Court ruling.
Effects on Global Trade Flows
Global merchandise trade in 2025 performed well above mid-year expectations, expanding approximately 4.6 percent for the full year, according to the World Trade Organization’s March 2026 Global Trade Outlook.3 That outcome was stronger than the WTO’s October 2025 forecast of 2.4 percent growth, driven by two forces: a surge in demand for AI-related goods such as semiconductors and servers, and aggressive frontloading by importers rushing to bring in goods ahead of anticipated tariff increases. The strong 2025 performance, however, obscures a weaker underlying trend. The WTO’s 2026 merchandise trade growth forecast stands at 1.9 percent, down from the 2.9 percent projected before the tariff escalation, as the one-time boost from frontloading fades and higher tariff costs increasingly weigh on trade flows.3
Frontloading, the practice of accelerating purchases before a cost increase takes effect, created a statistical distortion in 2025 that made trade volumes look stronger than underlying conditions warranted. A surge in U.S. imports in the first quarter of the year, up approximately 11 percent year-over-year in volume terms, pulled forward demand that would otherwise have occurred later. That correction is now materializing in 2026 and is expected to weigh on comparisons throughout the year.
Global trade routes are also shifting in character, not just volume. WTO and UN Trade and Development (UNCTAD) data show that while aggregate trade continued to expand, flows increasingly moved toward geopolitically aligned partners, even as supply chains still span long physical distances.4 The geography of trade is changing alongside its volume, a development with long-term implications for businesses that depend on cross-border supply chains.
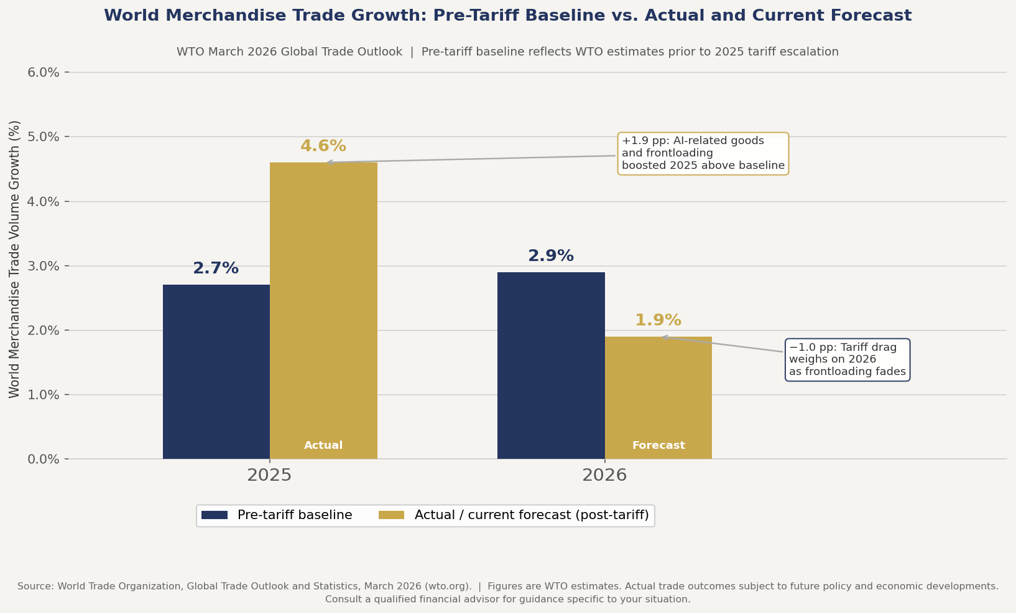
Figure 2: World Merchandise Trade Growth, 2025 actual and 2026 forecast vs. pre-tariff baseline. Source: WTO, March 2026. Figures are WTO estimates; actual outcomes subject to future policy and economic developments.
Supply Chains in Transition
For businesses with global supply chains, the tariff environment has created both immediate cost pressures and longer-term structural questions. UNCTAD estimates that in 2025, foreign direct investment in tariff-exposed and global value chain-intensive sectors; including textiles, electronics, and machinery, fell by approximately 25 percent.5 That decline reflects not only the direct cost effect of tariffs but also the uncertainty premium that businesses attach to planning in a frequently shifting policy environment.
UNCTAD notes that frequent policy shifts increase uncertainty, discourage investment, and disrupt supply chains, and that smaller, less diversified economies are most exposed to rising costs and trade volatility.5 In response, many firms are diversifying supplier relationships, relocating production closer to key markets, and shortening supply chains to reduce exposure to tariff risk. Countries with strong infrastructure, skilled workforces, and stable policy environments have been better positioned to attract this redirected investment.
The cost of uncertainty itself is difficult to quantify but real. When the rules governing cross-border commerce change frequently, businesses delay capital decisions, revise procurement strategies, and build in cost buffers that ultimately affect pricing and margins.
A Local Lens: Savannah and the Southeast
Few places in the United States sit closer to the intersection of tariff policy and real economic activity than Savannah, Georgia. The Port of Savannah is the third-largest container port in the United States, and the Georgia Ports Authority’s operations support more than 609,000 jobs statewide while contributing approximately $171 billion in annual revenue to Georgia’s economy.6
The tariff environment left a visible imprint on port activity in 2025. The Georgia Ports Authority reported that the port handled nearly 5.7 million twenty-foot equivalent units (TEUs) for the full calendar year 2025, a 2.6 percent increase over 2024.6 Activity was heavily front-loaded: the spring months saw exceptional volumes as importers accelerated shipments ahead of anticipated tariff increases, with March alone recording 533,995 TEUs. The second half of the year softened as that pull-forward demand faded, a pattern consistent with what trade data showed nationally.
The hangover from 2025’s frontloading surge is now evident in the 2026 data. Through April 2026, the port reported container volumes down approximately 2.5 percent year-over-year, with April alone registering a 14 percent decline from April 2025, which had been the port’s busiest April on record.7 Georgia Ports President and CEO Griff Lynch described customers as “managing through a softer market with higher operating costs.”
Despite the near-term headwinds, the port’s long-term investment posture remains confident. The Georgia Ports Authority has committed approximately $5 billion in infrastructure investment over the next decade, targeting five new container berths at Savannah and additional capacity at Brunswick.6 The Port of Brunswick, which handles automobile and heavy equipment cargo, saw Roll-on/Roll-off volumes decline approximately 7.5 percent in 2025 as manufacturers adjusted production and shipment strategies in response to tariffs on foreign vehicles, illustrating that the effects of trade policy are not uniform across cargo types. A financial advisor with knowledge of Southeast regional dynamics can help clients evaluate how these trends intersect with local business and real estate exposure.
Visual 2: Income stacking: with partial conversion vs. without
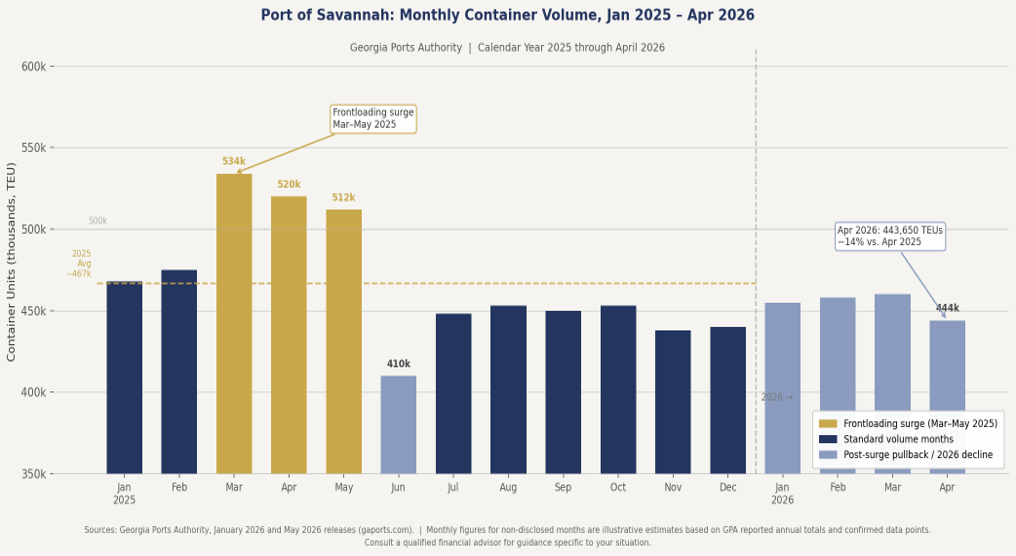
Figure 3: Port of Savannah Container Volume, Monthly trend, Jan 2025 through Apr 2026. Sources: Georgia Ports Authority, January 2026 and May 2026 releases (gaports.com). Monthly figures for non-disclosed months are illustrative estimates based on GPA reported annual totals and confirmed data points.
What Investors Are Watching
Tariffs affect investment portfolios in several ways, none of which operate in isolation. The most direct is corporate earnings: when input costs rise and cannot be fully passed to customers, margins compress. The Bank for International Settlements (BIS) September 2025 Quarterly Review notes that higher tariffs affect global supply chains through both demand and supply channels, with firms in tariff-exposed, globally integrated sectors carrying heightened exposure to cost shocks compared with those in more domestically oriented industries.8
The inflation dimension has been more measured than some anticipated. According to the Bureau of Labor Statistics, the Consumer Price Index for all items rose 2.7 percent from December 2024 to December 2025.9 The CBO estimated that the tariff increases in place through mid-2025 added approximately 0.4 percentage points to the annual inflation rate as measured by the personal consumption expenditures (PCE) index.10 The CBO’s February 2026 projections anticipate PCE inflation easing modestly from 2.8 percent in 2025 to 2.7 percent in 2026 as the effects of last year’s tariff increases begin to wane.1
Currency effects add another layer of complexity. The BIS notes that in countries heavily integrated into global value chains, tariff-driven supply disruptions can be inflationary in ways that complicate the exchange rate’s normal role as a shock absorber, amplifying cost pressures rather than dampening them.8 Sectors with high import content in their cost structures, or significant export exposure to markets facing retaliatory tariffs, have shown greater sensitivity to policy developments than those with more domestic supply chains. The heterogeneity of outcomes across sectors reinforces the case for working with a qualified financial advisor when evaluating portfolio positioning.
The Outlook Remains Open
The range of plausible outcomes from the current trade policy environment remains wide. The Supreme Court ruling on IEEPA tariffs removed one significant layer of the 2025 tariff structure, but a meaningful set of measures remains in place under other authorities, and the trajectory of trade policy, through further executive action, Congressional response, or negotiated agreements, is not settled. The WTO has noted that complete fragmentation of the global economy into two geopolitical blocs could produce macroeconomic losses of up to 7 percent of global real GDP, while more measured outcomes carry far smaller costs.3
What is clear is that the environment has changed in ways that are not easily reversed in the short term. Supply chain restructuring, once undertaken, is not quickly undone. Trade relationships, once redirected, do not automatically return to prior patterns. And fiscal dynamics, shaped in part by tariff revenues, will continue to interact with other policy decisions over a multi-year horizon, especially as the legal and legislative landscape around trade authority continues to evolve.
For investors and business owners, the practical implication is not to predict outcomes but to understand the exposures present in a portfolio or enterprise and to assess whether those exposures are consistent with longer-term financial goals.
Sources
1 Congressional Budget Office. The Budget and Economic Outlook: 2026 to 2036. February 11, 2026. cbo.gov.
2 Congressional Budget Office. An Update About CBO’s Projections of the Budgetary Effects of Tariffs. March 5, 2026. cbo.gov.
3 World Trade Organization. Global Trade Outlook and Statistics. March 2026. wto.org.
4 World Trade Organization. Global Trade Outlook and Statistics. March 2026. wto.org; UNCTAD. Global Trade Update. January 2026. unctad.org.
5 UNCTAD. Global Trade Update: Top Trends Redefining Global Trade in 2026. January 2026. unctad.org.
6 Georgia Ports Authority. Port of Savannah Achieves Second Busiest Year Ever. January 27, 2026. gaports.com.
7 Georgia Ports Authority. Georgia Ports Container Volumes, May 2026 release. gaports.com.
8 Bank for International Settlements. BIS Quarterly Review, September 2025: Tariffs, Monetary Policy, and Global Supply Chains. bis.org.
9 U.S. Bureau of Labor Statistics. Consumer Price Index: 2025 in Review. January 2026. bls.gov.
10 Congressional Budget Office. Budgetary and Economic Effects of Increases in Tariffs Implemented Between January 6 and May 13, 2025. June 2025. cbo.gov.
DISCLOSURE
This article is provided for informational and educational purposes only and does not constitute investment advice, a solicitation, or an offer to buy or sell any security. No fiduciary relationship is created by reading or relying on this content. All figures, scenarios, and examples presented are illustrative only and are not projections or guarantees of any outcome. Figures sourced from government agencies and international organizations reflect data and projections as of their respective publication dates and are subject to revision. Readers should consult a qualified financial advisor or tax professional before making any financial or tax-related decisions.
Chatham Capital Group, LLC is an SEC-registered investment adviser headquartered in Savannah, Georgia. Registration does not imply a certain level of skill or training. For more information, please review our Form ADV Part 2A, available at adviserinfo.sec.gov, and our Form CRS, available at chathamcapitalgroup.com/s/Form-CRS.pdf.
© Chatham Capital Group, LLC. All rights reserved.