
Why Inflation Feels Stuck: The Last Mile Paradox
After a historic disinflation, the final step back to 2 percent is proving slower and more complex. Structural costs, measurement lags, and expectation dynamics are acting as an inflationary wall that the economy is struggling to overcome.
The economic landscape of early 2026 presents a stark contrast to the inflationary turbulence that was so prevalent in recent years. To better understand the current climate, one must revisit the economic atmosphere of June 2022, when headline inflation was the highest level it had been in over forty years, and peaked at 9.0%.1 The reaction at that point in time was panic; markets were in a tailspin, and the Federal Reserve entered into a series of 75-basis-point interest rate hikes to suppress the exploding inflation expectations. Now, in the first quarter of 2026, the narrative has shifted from panic to a grinding, structural frustration. The headline inflation rate, as measured by the Consumer Price Index (CPI), has retreated significantly but feels stuck at approximately 3%.2
The initial rapid improvement followed by an annoying persistence is the core of the Last Mile paradox. Mathematically and historically, it has proven far easier for the economy to shed the first 600 basis points of inflation—achieved through the normalization of energy prices and the uncurling of pandemic-era supply chain knots—than it is to close the final 100-basis-point gap between 3% and the Federal Reserve’s elusive 2% target.2 This final mile is not as straight a path as one might imagine, as shelter costs, supply-chain shifts, and labor dynamics create a formidable ceiling.
Visual 1: The Inflation Journey - Panic vs. Persistence
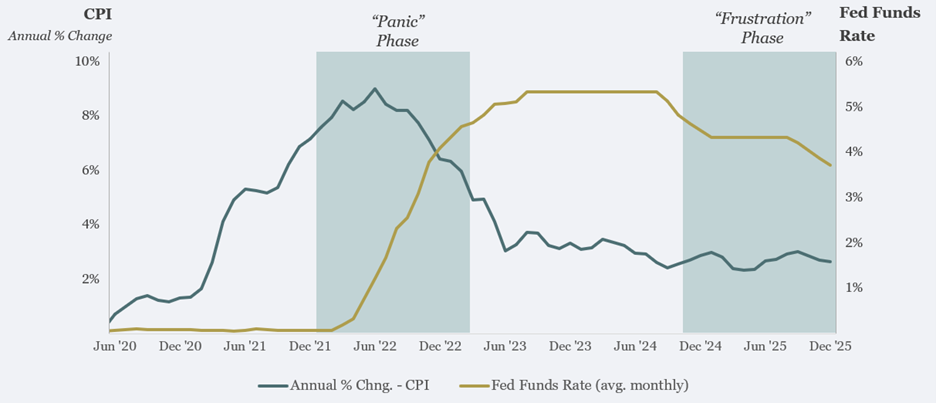
Source: FRED, Federal Reserve Bank of St. Louis2,31
The Shelter Lag: The Math Behind the Ceiling
The single most significant obstacle to reaching the 2% inflation target is the shelter component of the CPI, which accounts for over 35% of the total index and more than 40% of the core CPI basket.3 While home sales hover near historic lows, shelter data in in early 2026 remains surprisingly resilient.4 To understand this disconnect, one must look at how the Bureau of Labor Statistics (BLS) measures housing costs – specifically through Owner’s Equivalent Rent (OER)3, which is a metric that structurally often lags behind real-time market shifts.
As of the January 2026 reporting cycle, OER is still hovering around 3.4% year-over-year.5 Because shelter accounts for more than one-third of the inflation basket6, this effectively acts as a floor for headline inflation. With OER at 3.4%, other components would need to experience deep sustained deflation to pull the aggregate number down to 2%.3
Additionally, there is a lag that is structurally built-in to OER, which is a fundamental feature of the measurement. Most Americans live in houses they own or are on year-long rental leases. Consequently, changes in market rent—what a new tenant pays today—take between six and twelve months to fully filter into the government’s index.4
Table 1: Shelter Inflation Dynamics and Measurement Lags (December 2025)
This data illustrates why the aggregate index remains buoyed by the housing sector despite broader economic cooling.
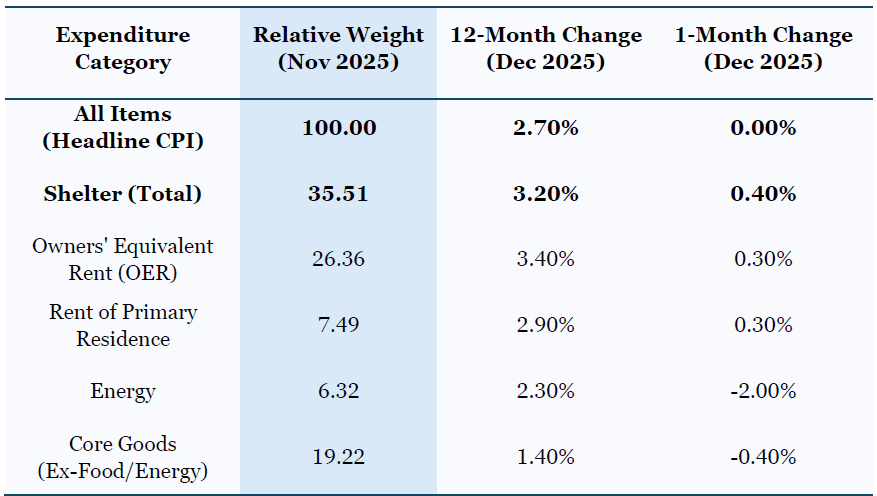
Source: U.S. Bureau of Labor Statistics6
The table reveals a stark divergence. While energy prices provided significant downward pressure in late 2025, falling 2.0% in a single month, the shelter component—nearly six times the weight of energy—continued to rise by 0.4%.6 This imbalance is one of the main reasons the Federal Reserve is having trouble landing at 2.0%. Unsurprisingly, OER remains the stickiest component, reflecting the fact that existing home prices bottomed out in late 2023 and have been rising gradually ever since, further fueling what homeowners believe their rental value should be.3
Visual 2: The Delayed Effect of Rent Changes
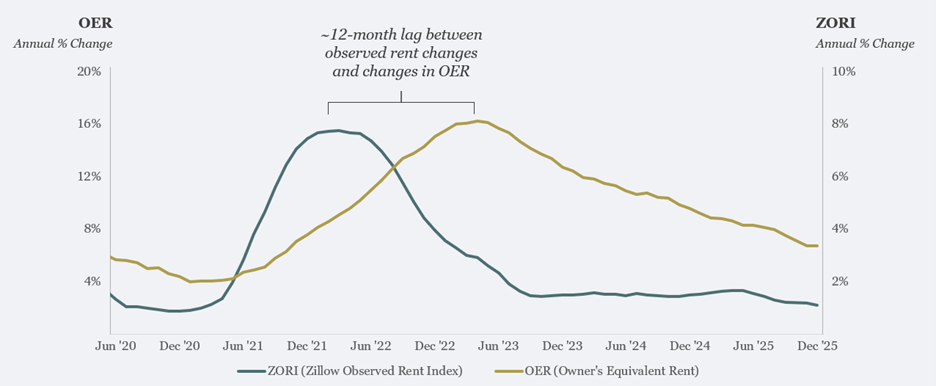
Source: U.S Bureau of Labor Statistics5, Zillow4
The Cost of Resilience: New Pressures in Core Goods
While the supply chain clogs of 2022 have largely cleared, a new set of structural pressures has emerged in the goods sector. Global trade in 2026 is defined by a shift toward onshoring and geopolitical resilience. This transition has introduced volatility that prevents a return to the long-term deflationary trend once seen in electronics and apparel.
Shipping itself isn’t expensive the way it was in 2021–2022, but the uncertainty adds significant costs. By early February 2026, composite spot container benchmarks had eased back toward the low-$2,000 range per 40-foot container22, reflecting a market that is no longer in the scarcity pricing regime of the pandemic era. However, normalization in shipping rates has not restored the traditional deflationary playbook for core goods. UNCTAD has argued that freight-rate volatility—driven by rerouting, geopolitical risk, and shifting trade policy—has grown to be a persistent feature of global trade costs, even when headline spot prices are not surging.23
What this means is that the resilience premium has moved from income statement invoices to balance sheets. Companies are paying less for the container and more for the optionality through dual-sourcing contracts, redundant suppliers, and higher safety-stock buffers. This works to insulate against disruptions but results in higher carrying costs. In the current higher-rate world, every extra week of inventory in transit or sitting in a warehouse has a financing cost that did not matter as much a decade ago. This is an important distinction for core goods inflation in 2026: the overall supply chain system may be unclogged but is structurally more expensive due to the extra cost of stability.
Furthermore, the surge in Artificial Intelligence (AI) infrastructure has created a new bottleneck: energy. Grid access is increasingly becoming a binding constraint, particularly in regions experiencing data-center clustering. The U.S. Energy Information Administration has explicitly tied renewed growth in electricity consumption to new large loads, including data centers, after a long period of flat demand.24 At the system level, major grid operators are now formalizing large load adjustments in long-term forecasts—an acknowledgment that data centers are no longer marginal demand.25 Globally, the EIA expects electricity usage to grow strongly through 2027, citing the increasing demand from large computing centers as the key factor driving the demand growth.26 Further, the EIA is projecting that Computing, currently the smallest source of purchased electricity, to be the largest source of purchased power by 2050.33 The result is a modern goods-sector cost pressure due to higher connection costs, longer project timelines, and upward pressure on electricity-intensive inputs.
Visual 3: The Resilience Premium - Shipping & Power Surge
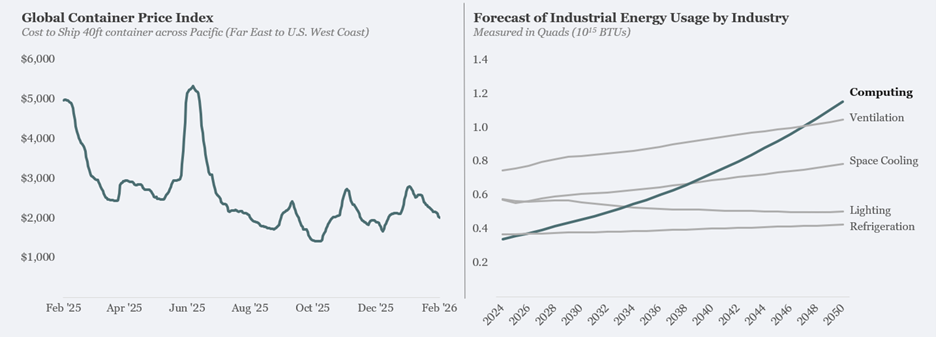
Source: Xeneta33, EIA34
The Labor Bifurcation: Why Services Stay Hot
While the goods sector is grappling with structural shifts, inflation in the service sector is being driven by a distinct set of labor market dynamics.3 In 2026, the U.S. labor market is in a "low-hire, low-fire" mode.17 While overall job creation has slowed to approximately 50,000 per month—down from the hundreds of thousands seen in the post-pandemic recovery—unemployment remains remarkably stable at 4.4% to 4.5%.7
The apparent stability hides a deep bifurcation in the labor market. Trade-reliant sectors like manufacturing and wholesale retail have been shedding jobs as they contract under the weight of higher import costs.3 Conversely, the healthcare and social assistance sectors are experiencing exceptionally strong demand that is fundamentally detached from the business cycle.8 As the U.S. population ages, the demand for medical services, hospital care, and senior assistance continues to grow, providing a tailwind for these industries.8
This demand creates a wage floor that keeps services’ inflation (car repairs, haircuts, medical visits) trending at 3% to 4% annually. Service industries are labor-intensive; unlike a manufacturing plant, a hospital or a barbershop cannot easily use automation to offset rising wages.3 In 2026, real average hourly earnings are growing at a steady 1.1% year-over-year.9 While this is a positive development for workers, it forces service providers to continuously raise prices to cover their growing payroll obligations.3
Table 3: Sectoral Labor Demand and Service Price Pressures (Jan 2026)
This comparison shows how demographic trends and labor shortages in specific sectors are fueling persistent inflation.
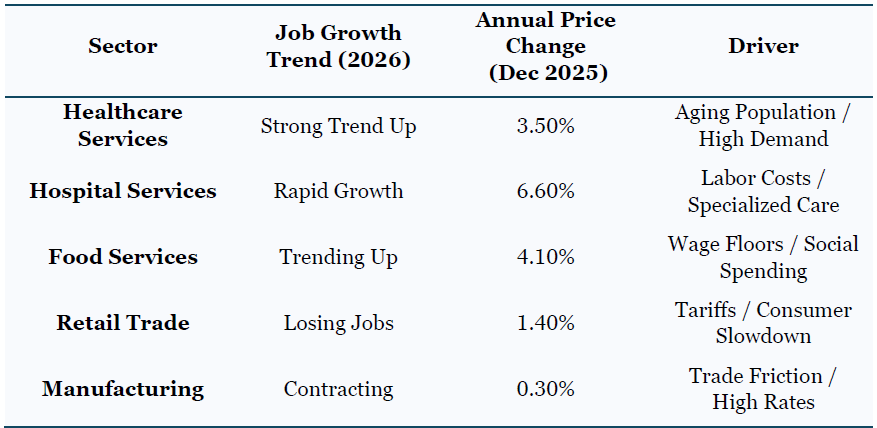
Source: U.S Bureau of Labor Statistics5
The impact of wage floor policies cannot be ignored. In 2026, a total of 22 states and 66 cities/counties will raise their minimum wage levels.10 In 79 of these jurisdictions, the floor will reach or exceed $15.00, and in 57 jurisdictions, it will hit $17.00 or more.10 For the service sector, this represents a non-negotiable increase in the cost of doing business. When a state like New York or California raises its minimum wage to $17.00, every coffee shop, dry cleaner, and home health agency in that region must adjust its price list accordingly to maintain solvency.10
The Expectation Anchor: The Psychology of 3%
Inflation is as much a psychological phenomenon as it is a mathematical one. In 2026, the Federal Reserve is battling the Salience Effect— a cognitive bias where consumers remember and overweight the price of goods they purchase frequently, such as eggs, milk, and gasoline, while ignoring the aggregate deflation of less frequent purchases.11
Despite the objectively improving baseline, the American consumer remains scarred by the 2022 inflation shock.12 Even if the official CPI is 2.7%, a consumer who sees a 34% jump in the price of their favorite clothing brand or a 20% increase in their car insurance feels that prices are still surging out of control.13 This psychological anchor is dangerous because it encourages businesses to keep raising prices; if customers expect prices to go up, they are less likely to reduce their consumption when those increases occur.12
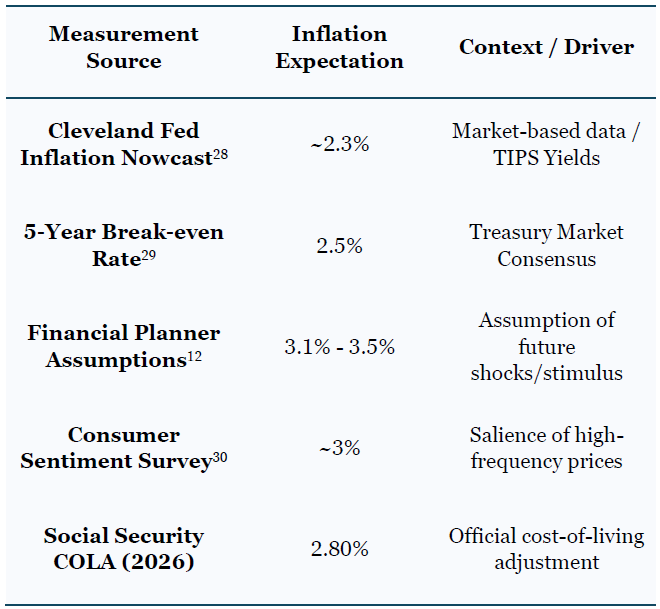
There is currently a significant gap between professional and consumer inflation expectations. The Federal Reserve Bank of St. Louis’s 5-year inflation expectations—which use sophisticated modeling of bond yields and risk premia—point to a stable 2.3%.34 However, consumer-based expectations for the next 5 years are less optimistic, anticipating a persistent ~3%.29 This gap suggests that while the smart money believes the Fed will eventually win the war on inflation, while the public believes a 3% reality is here to stay.
Table 4: The Expectation Gap - Expert Models vs. Consumer Sentiment
This disparity highlights the risk of a self-fulfilling inflationary cycle.
This expectation anchor is further reinforced by the House-Money Effect and Salience of Price Hikes.15 Consumers are more likely to notice a 4.9% increase in a restaurant bill (Food Away From Home) than they are to appreciate a 0.9% drop in the price of cheese (Dairy and Related Products).30 In the early months of 2026, with 75 million Americans receiving a 2.8% increase in Social Security benefits, there is just enough liquidity in the system to support these higher price levels, even if consumer sentiment remains uncomfortably negative.16
The Fed’s Dilemma: 2% Target or New Reality?
As the Federal Open Market Committee (FOMC) enters the middle of 2026, they face a historic policy choice that will define the American economy for the next decade. The Last Mile has proven so arduous that the central bank is effectively caught in a tug-of-war between two factions: the Hawks and the Re-anchorers.3
The Hawks argue that the Fed must keep the federal funds rate higher for longer—potentially in the 3.5% to 4% range—until inflation is forced down to exactly 2.0%.7 They fear that if the Fed eases too early, they will repeat the mistakes of the 1970s, where inflation was allowed to smolder and then re-ignite into a second, more damaging wave.3 The risk of this approach is a structural recession or a significant no-hire regime where the labor market finally breaks under the weight of high borrowing costs.17
The Re-anchorers, on the other hand, suggest that the 2% has always been arbitrary, and should be re-evaluated as a target based on today’s dynamics.18 They point out that the 2026 economy is structurally more expensive to run than the 2016 economy. A world of higher tariffs, an aging labor force, increased defense spending, and the massive energy demand required for AI infrastructure could mean that 3% might be the new neutral.3 If the Fed continues to fight for 2% in an economy that is structurally designed for 3%, they are essentially fighting a war against the demographic and policy reality of the nation.8
Table 5: 2026 Global Economic Divergence - The Inflation Struggle
Different regions are making distinct policy choices.
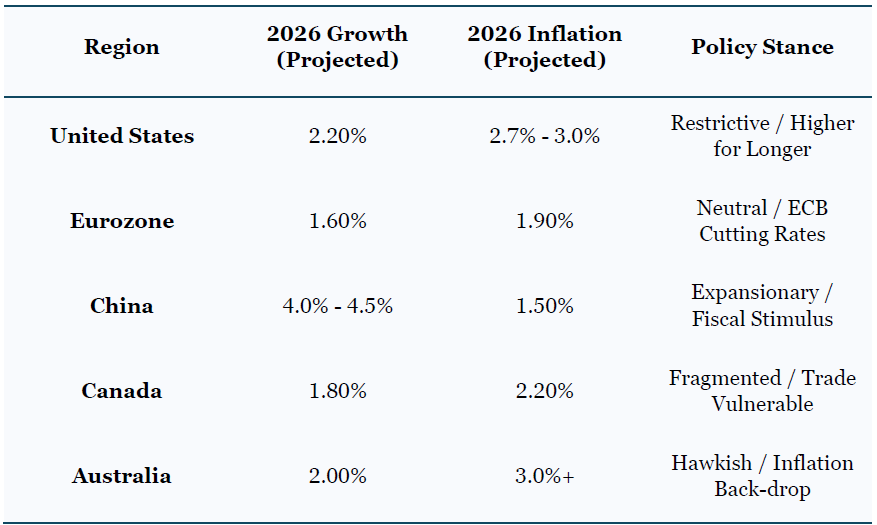
Source: RBC, ECB, BNP Paribas19
The divergent data between the U.S. and the Eurozone is particularly telling. While the ECB is approaching its 1.9% target and shifting to a neutral stance to support growth, the U.S. Fed remains hesitant.20 This hesitation is based in the No-Landing paradox.3 As long as U.S. household net worth continues to rise—it grew by $13.7 trillion in 2025 alone—the Fed knows that consumer demand will remain robust enough to keep inflation from falling to that 2% goal.21
Conclusion: The Price of Reality
While persistent and frustrating, inflation in 2026 isn't broken. The Last Mile is not a measurement of the Fed's failure, but a highlight of fundamental shifts that are continuing to play out. The choice remains to keep striving to reach the 2% goal, or to re-anchor and accept 2.5% to 3% as the unofficial target. If the Federal Reserve chooses the latter, they will be acknowledging that the Last Mile was never a distance to be traveled, but a new, structural barrier created by the increased cost of running the American engine.
1. 12-month percentage change, Consumer Price Index, selected categories, accessed February 2, https://www.bls.gov/charts/consumer-price-index/consumer-price-index-by-category-line-chart.htm
2. The 'No-Landing' Paradox: Sticky Inflation Meets Red-Hot Growth in Late 2025, accessed February 2, 2026, https://markets.financialcontent.com/prnews.pressre/article/marketminute-2025-12-23-the-no-landing-paradox-sticky-inflation-meets-red-hot-growth-in-late-2025
3. Five themes for the US economy in 2026 - RBC Economics, accessed February 2, 2026, https://www.rbc.com/en/economics/us-analysis/us-featured-analysis/five-themes-for-the-us-economy-in-2026/
4. Zillow: CPI Shelter Forecast, November 2025, accessed February 2, 2026, https://www.zillow.com/research/cpi-forecast-2025-nov-35832/
5. CPI Home: U.S. Bureau of Labor Statistics, accessed February 2, 2026, https://www.bls.gov/cpi/
6. Table 1. Consumer Price Index for All Urban Consumers (CPI-U): U. S. city average, by expenditure category - Bureau of Labor Statistics, accessed February 2, 2026, https://www.bls.gov/news.release/cpi.t01.htm
7. Economic outlook for 2026, focusing on the United States, the UK, Canada and Australia, accessed February 2, 2026, https://rsmus.com/insights/economics/economic-outlook-for-2026.html
8. How AI & Rising Productivity Are Fueling U.S. Growth in 2026 - LPL Financial, accessed February 2, 2026, https://www.lpl.com/research/weekly-market-commentary/the-productivity-advantage-powering-economic-growth-in-2026.html
9. Real Earnings Summary - 2025 M12 Results - Bureau of Labor Statistics, accessed February 2, 2026, https://www.bls.gov/news.release/realer.nr0.htm
10. Raises from Coast to Coast in 2026 - National Employment Law Project, accessed February 2, 2026, https://www.nelp.org/insights-research/raises-from-coast-to-coast-in-2026/
11. Full article: Good Policy or Good Luck? Why Inflation Fell Without a Recession - Taylor & Francis, accessed February 2, 2026, https://www.tandfonline.com/doi/full/10.1080/08911916.2024.2419240
12. The Financial Planner's 2026 Outlook Guide - Discipline Funds, accessed February 2, 2026, https://ria.disciplinefunds.com/2025/12/31/the-financial-planners-2026-outlook/
13. 11 Products Getting More Expensive in 2026 - AARP, accessed February 2, 2026, https://www.aarp.org/money/personal-finance/prices-going-up/
14. Inflation Expectations - Federal Reserve Bank of Cleveland, accessed February 2, 2026, https://www.clevelandfed.org/indicators-and-data/inflation-expectations
15. The Art of Thinking Clearly - Chamber of Psychology and Counselling, accessed February 2, 2026, https://cpcglobal.org/publications/The%20Art%20of%20Thinking%20Clearly.pdf
16. Cost-of-Living Adjustment (COLA) Information | News | SSA - Social Security, accessed February 2, 2026, https://www.ssa.gov/cola/
17. Equity Capital Markets Book - Ramirez & Co., accessed February 2, 2026, http://www2.ramirezco.com/insights/WeeklyEconomicUpdate-8Jan2026.pdf
18. INVESTMENT OUTLOOK 2026, accessed February 2, 2026, https://jsil.com/wp-content/uploads/2026/01/JSIL-Investment-Outlook-2026.pdf
19. Global economic outlook | RBCCM, accessed February 2, 2026, https://www.rbccm.com/en/insights/2025/12/global-economic-outlook
20. 2026 Economic Outlook in Advanced Countries: Building on the Success of 2025, accessed February 2, 2026, https://economic-research.bnpparibas.com/html/en-US/2026-Economic-Outlook-Advanced-Countries-Building-Success-2025-1/13/2026,53133
21. OUTLOOK FOR 2026 - Derivative Logic, accessed February 2, 2026, https://derivativelogic.com/wp-content/uploads/WILTM-26-Outlook-Edition.pdf
22. Drewry Supply Chain Advisors | World Container Index, accessed February 5, 2026, https://www.drewry.co.uk/supply-chain-advisors/supply-chain-expertise/world-container-index-assessed-by-drewry
23. UN Trade & Development | Review of maritime transport 2025, accessed February 5, 2026, https://unctad.org/publication/review-maritime-transport-2025
24. EIA Today in Energy | January 15, 2025 EIA extends five key energy forecasts through December 2026, https://www.eia.gov/todayinenergy/detail.php?id=64264
25. 2026 PJM Load Forecast Report, January 14, 2026, https://www.pjm.com/-/media/DotCom/library/reports-notices/load-forecast/2026-load-report.pdf
26. EIA | EIA forecasts strongest four-year growth in U.S. electricity demand since 2000, fueled by data centers, accessed February 5, 2026, https://www.eia.gov/pressroom/releases/press582.php
27. Federal Reserve Bank of Cleveland | Inflation Nowcasting, accessed February 6, 2026, https://www.clevelandfed.org/indicators-and-data/inflation-nowcasting
28. Federal Reserve Bank of St. Louis | 5-Year Breakeven Inflation Rate, accessed February 6, 2026, https://fred.stlouisfed.org/series/T5YIE
29. Federal Reserve Bank of New York | Center for Microeconomic Data, Survey of Consumer Expectations, accessed February 6, 2026, https://www.newyorkfed.org/microeconomics/sce#/influncert-1
30. Federal Reserve Bank of Boston | Why Have Inflation Expectations Surged Recently? A Historical Perspective, October 9, 2025, https://www.bostonfed.org/publications/current-policy-perspectives/2025/why-have-inflation-expectations-surged-recently.aspx
31. Federal Reserve Bank of St. Louis| Federal Funds Effective Rate (avg. monthly), accesses February 6, 2026, https://fred.stlouisfed.org/series/DFF
32. Xeneta Shipping Index | Global Container Price Index, accessed February 6, 2026, https://xsi.xeneta.com/
33. EIA | Annual Energy Outlook 2025, accessed February 6, 2026, https://www.eia.gov/outlooks/aeo/data/browser/#/?id=5-AEO2025®ion=0-0&cases=ref2025&start=2023&end=2050&f=A&linechart=~ref2025-d032025a.17-5-AEO2025~ref2025-d032025a.19-5-AEO2025~ref2025-d032025a.21-5-AEO2025~~ref2025-d032025a.23-5-AEO2025~ref2025-d032025a.22-5-AEO2025&map=&ctype=linechart&sourcekey=0
34. Federal Reserve Bank of St. Louis | 5-Year Expected Inflation, accessed February 9, 2026, https://fred.stlouisfed.org/series/EXPINF5YR