
What Your Cash Is Earning: Short-Term Rates After the Fed’s September Decision
How bank deposits, money market funds, and Treasury bills respond differently when the Federal Reserve moves rates
Originally published October 2026.
The Fed’s September Decision
On September 16, 2026, the Federal Open Market Committee (FOMC) voted unanimously to raise the target range for the federal funds rate by one quarter of a percentage point, to 3.75%-4.00%.1 Whether further changes follow depends on future economic conditions and Committee decisions.
What a policy change does offer is a natural moment to review how cash is held. Short-term rates do not reach every cash vehicle at the same speed or to the same degree. For investors holding substantial balances outside their long-term portfolios, those differences can matter. A qualified financial advisor can help evaluate how they apply to a particular situation.
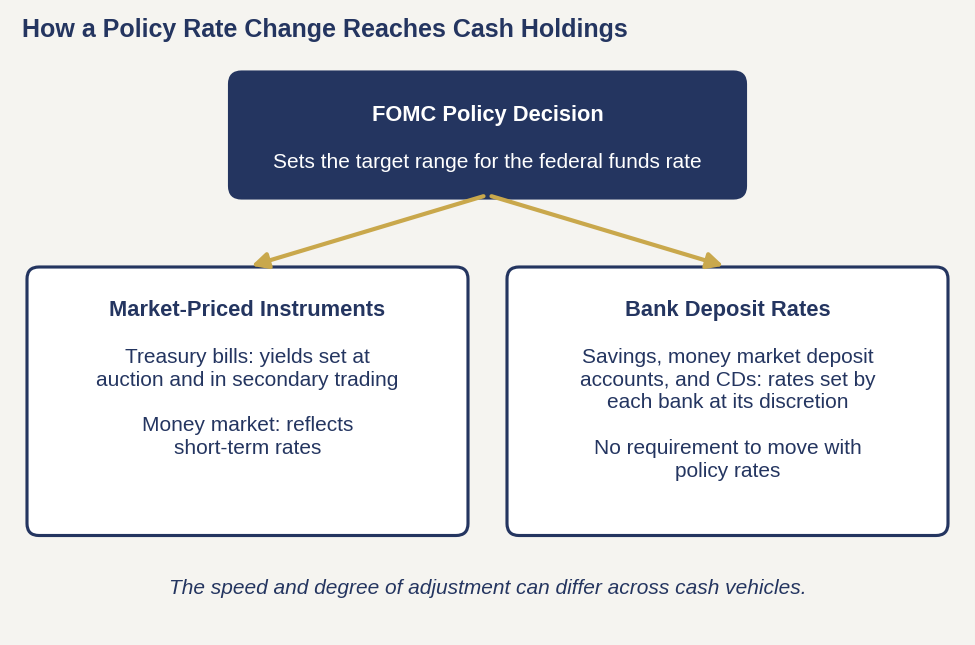
Figure 1. Conceptual illustration only. See Important Disclosures.
How Rate Changes Reach (or Don’t Reach) Your Cash
Treasury bill yields are set by the market through regular Treasury auctions and secondary trading, so they tend to adjust quickly when expectations for policy rates change. The 3-month Treasury bill rate published by the Federal Reserve stood at 3.57% on May 20, 2026, and 4.08% on September 24, 2026, on a discount basis.2
Bank deposit rates work differently. Each bank sets its own rates, and nothing requires them to move with policy rates. The FDIC publishes a monthly Average National Savings Account Rate, which reflects rates paid by insured institutions and credit unions, weighted by each institution’s share of domestic deposits. That figure was 0.38% in May 2026 and 0.37% in September 2026.3
Applied to $100,000 from September 28, 2021, through September 28, 2026, the rates in Figure 2 produce a balance of approximately $101,700 at the Average National Savings Account Rate and approximately $120,700 at the 3-month Treasury bill rate, before taxes. These figures show how differences in rates compound over time. They do not reflect differences in insurance, liquidity, or risk, which are discussed below.
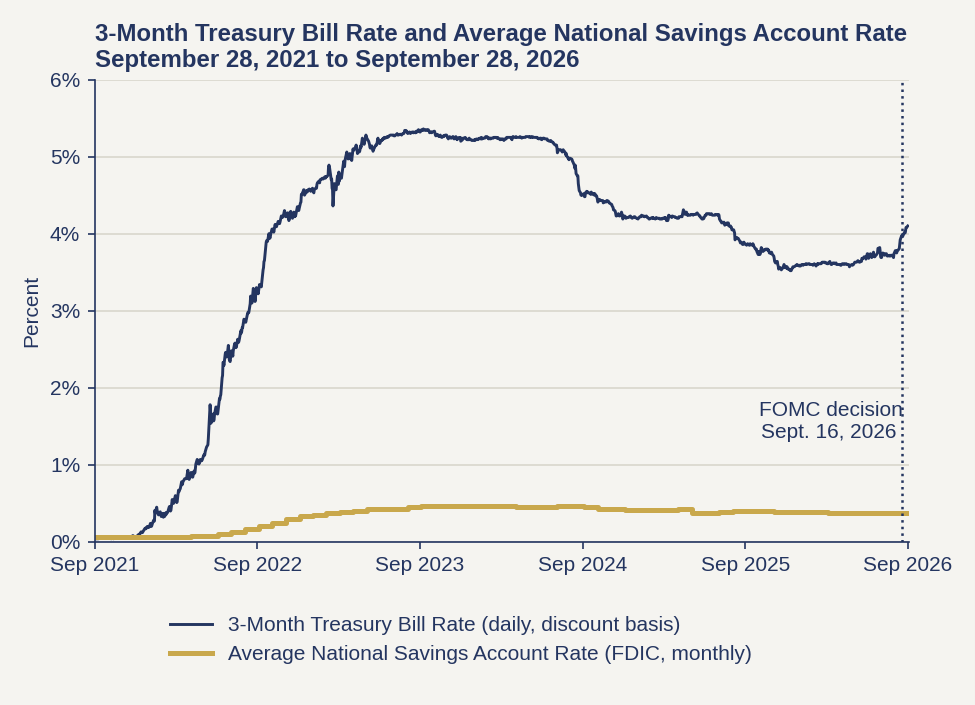
Figure 2. The two rates are not directly comparable. Historical rates are not indicative of future rates. The example calculation above is not a recommendation. See Important Disclosures.
These two rates are not a direct comparison. A savings account and a Treasury bill differ in insurance, liquidity, and how interest is quoted. The national average also blends accounts paying well above and well below it, and monthly figures may not yet reflect the September decision. The data do show that deposit rates and market rates can move independently, and that the rate a given account pays is worth confirming directly rather than assuming. An advisor can help interpret what a specific account is earning relative to available alternatives.
These options also differ in ways beyond yield. Bank deposits are FDIC-insured up to applicable limits, while money market funds and Treasury bills are not.4 Money market funds can lose value,5 and a Treasury bill sold before maturity may be worth more or less than its purchase price.6
Questions to Consider
A change in policy rates does not by itself call for any particular action. It can be a useful prompt to ask a few practical questions:
What is this account actually paying? Confirming the current rate, rather than relying on the rate at account opening, provides a factual starting point.
How much of this balance is operating cash? Separating funds needed for near-term expenses from longer-term reserves can clarify which balances are rate-sensitive.
Is the balance within insurance limits? Reviewing coverage by bank and ownership category at fdic.gov can identify concentrations.
How does after-tax yield compare? State tax treatment can change the comparison between otherwise similar options.7
Each of these questions depends on individual goals, liquidity needs, and tax situation. A qualified tax or financial advisor can help work through them.
Important Disclosures
This article is provided for informational and educational purposes only and does not constitute investment, tax, or legal advice, or a recommendation to buy, sell, or hold any security or to adopt any strategy. Reading this article does not create an advisory or fiduciary relationship. Investors should consult a qualified tax or financial advisor regarding their individual circumstances before making any decision.
Interest rates, yields, and tax rules referenced are as of the dates noted and are subject to change. FDIC deposit insurance coverage limits and ownership category rules are available at fdic.gov. Figures that are adjusted annually are available at irs.gov. Information has been obtained from government and other sources believed to be reliable, but its accuracy and completeness are not guaranteed.
Figure 1. Simplified conceptual illustration for informational purposes only; it does not depict the timing or magnitude of any rate change. Consult a qualified tax or financial advisor regarding individual circumstances.
Figure 2. The Average National Savings Account Rate is the FDIC’s National Rate: Savings. Study period September 28, 2021, through September 28, 2026, the latest Treasury bill observation available at the time of preparation. Treasury bill rates are daily, and days without an observation, such as market holidays, are omitted. The savings rate is published monthly and is shown as a constant value for each month; it is a deposit-weighted average, and individual accounts may pay more or less. The two instruments differ in insurance, liquidity, and how interest is quoted, and are not directly comparable. The dotted line marks the date of the FOMC decision described in the text. Historical rates are shown for informational purposes only and are not indicative of current or future rates. Consult a qualified tax or financial advisor regarding individual circumstances.
Illustrative calculation only; not a recommendation to purchase any investment or to move funds. Assumes $100,000 earned each published rate for each calendar day of the period, with interest accrued daily on a 365-day basis and reinvested, and no taxes, fees, or transaction costs. The savings calculation applies the FDIC’s monthly National Rate: Savings to each day of the month; the national rate is a deposit-weighted average, and individual accounts may earn more or less. The Treasury bill calculation applies the daily 3-month Treasury bill rate, carrying the most recent rate over weekends and holidays; that rate is quoted on a discount basis and is used as an approximation of yield, and actual results from purchasing and rolling Treasury bills would differ. Treasury bills are not FDIC-insured. Historical rates are not indicative of future results. Consult a qualified tax or financial advisor regarding individual circumstances.
Chatham Capital Group, Inc. is an investment adviser registered with the U.S. Securities and Exchange Commission and headquartered in Savannah, Georgia. Registration does not imply a certain level of skill or training. Additional information about Chatham Capital Group, Inc., including its Form ADV Part 2A, is available at adviserinfo.sec.gov. Form CRS is available at chathamcapitalgroup.com/s/Form-CRS.pdf.
Sources
1. Board of Governors of the Federal Reserve System, “Federal Reserve issues FOMC statement,” press release, September 16, 2026. https://www.federalreserve.gov/newsevents/pressreleases/monetary20260916a.htm
2. Board of Governors of the Federal Reserve System, H.15 Selected Interest Rates, “3-Month Treasury Bill Secondary Market Rate, Discount Basis” [DTB3], retrieved from FRED, Federal Reserve Bank of St. Louis. https://fred.stlouisfed.org/series/DTB3
3. Federal Deposit Insurance Corporation, National Rates and Rate Caps, Monthly Update, “National Rate: Savings” [SNDR], retrieved from FRED, Federal Reserve Bank of St. Louis. https://fred.stlouisfed.org/series/SNDR
4. Federal Deposit Insurance Corporation, “Understanding Deposit Insurance.” https://www.fdic.gov/resources/deposit-insurance/understanding-deposit-insurance
5. U.S. Securities and Exchange Commission, Office of Investor Education and Assistance, “Money Market Funds: Investor Bulletin,” November 4, 2024. https://www.investor.gov/introduction-investing/general-resources/news-alerts/alerts-bulletins/investor-bulletins/updated-12
6. U.S. Securities and Exchange Commission, Office of Investor Education and Advocacy, "Investor Bulletin: Fixed Income Investments — When Interest Rates Go Up, Prices of Fixed-Rate Bonds Fall," Investor.gov, June 26, 2013, https://www.investor.gov/introduction-investing/general-resources/news-alerts/alerts-bulletins/investor-bulletins-86.
7. 31 U.S.C. § 3124(a). https://www.govinfo.gov/content/pkg/USCODE-2023-title31/html/USCODE-2023-title31-subtitleIII-chap31-subchapII-sec3124.htm